Or am I just not looking in the right places? Anyway I’ve created my own.
Obviously I stumbled into netshoot, network-multitool(Outdated!) which now is from WBITT and also doks-debug from Digital Ocean.
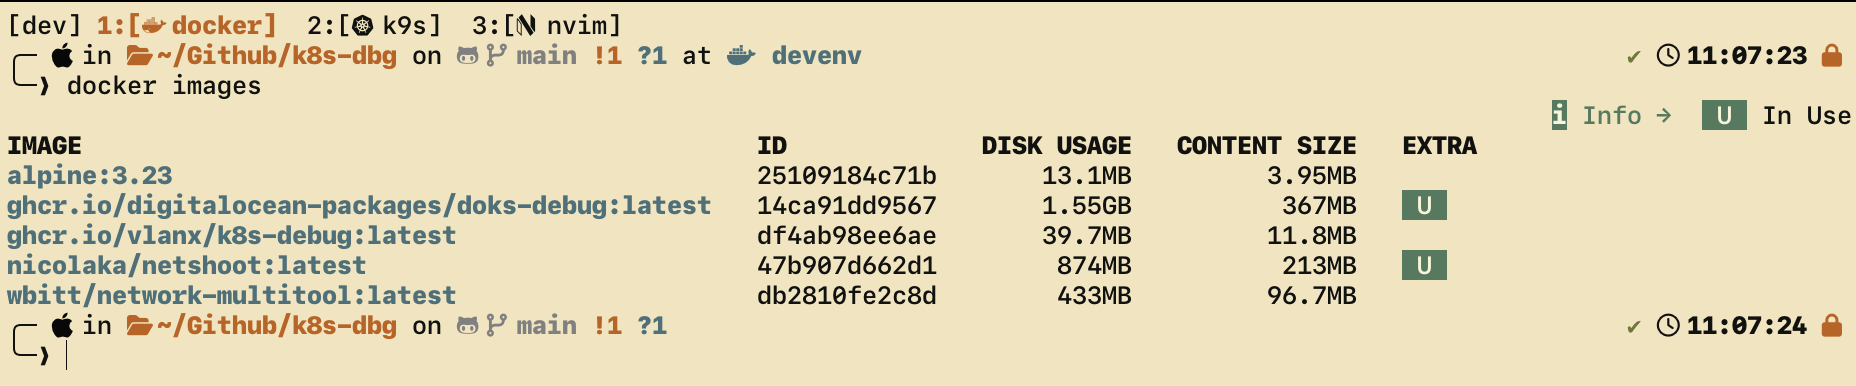
But just look at the size of those things. I mean, network is fast and all but I don’t like bloat just because.
Plus, it created an opportunity for me to build one tailored to my needs and made me mess around with scheduled Github Actions Workflows, which I didn’t even knew existed.
The Github Actions workflow right now uses cron to rebuild the image once per week, on every sunday. It also rebuilds on commits and via dispatcher. It really could not be simpler. The Dockerfile has the necessary labels to pin it to the repo automatically and it tags it with latest too.
Since my goal was to have this container be a drop-in tool to enter a kubernetes cluster and look around and debug as if I was another pod, I had to make this workflow and troubleshooting sessions more ergonomic.
Onto the interesting part:
kdbg Script
Source is here!
╰─❯ kdbg -h
Usage: kdbg [options]

Options:
  -n, --namespace NAME       Namespace for the debug pod.
  -N, --node NAME            Pin the pod to a specific node.
      --serviceaccount NAME  ServiceAccount name (default: default).
      --privileged           Run the pod in privileged mode.
      --host-network         Join the node network namespace.
      --cmd 'COMMAND'        Run a one-shot command instead of an interactive shell.
  -h, --help                 Show this help.

Environment:
  KDBG_IMAGE                 Image to run (default: ghcr.io/vlanx/k8s-debug:latest).
Just a bash wrapper function around the calling of this debug container. It allows for namespace and node specification, along with an option to run a one-shot command.
Example usage
On a specific namespace and node:
kdbg --namespace kube-system --node some-node.devWith elevated privileges:
kdbg --host-network --privileged --cmd 'tcpdump -ni any port 53'Or, if you want to run this container by hand without the helper script I created:
# Open a shell in the default namespace
kubectl run k8s-dbg-pod \
  --namespace default \
  --image ghcr.io/vlanx/k8s-dbg:latest \
  --restart=Never \
  --rm \
  --attach \
  -it \
  --command -- /bin/sh
Which tools are in the container
Not a lot, just enough to be a usefull network-wise debug and troubleshoot. Plus, if I deem or someone recommends something that should be added, I’ll be more than happy to consider it.
curlfor HTTP(S) requests and service probingbind-toolsfor DNS troubleshooting (dig,nslookup)iproute2for inspecting interfaces, routes, and addressesnetcat-openbsdfor simple TCP/UDP connectivity checks (nc)jqfor parsing JSON responses from APIs and service endpointstcpdumpfor packet capture when the pod is launched with sufficient privilegesbusybox-extrasplus the default Alpine / BusyBox userland
The default shell is /bin/sh, as provided by Alpine.